CFO360 is the finance command centre for companies that outgrew spreadsheets. A real double-entry ledger, IFRS statements, cash-flow projection, AP/AR and board KPIs — all derived live from the posted journal, so your reports can never disagree with your books.
Double-entry · IFRS statements · 13 & 26-week cash flow · UAE VAT & corporate tax
The board pack takes a week to assemble. The numbers are already a month old. Four systems hold four versions of the truth — and someone spends their month reconciling them by hand.
The P&L is built in a spreadsheet from an export. The moment the ledger moves, the report is stale.
Closing the books means chasing invoices, re-keying entries and hunting for the difference that won't balance.
Profitability says fine. The bank account says otherwise. Nobody saw the dip coming because nobody projected it.
AI tools give you an answer with no way to trace where the number came from — so it can't be trusted with money.
The problem isn't your finance team. The problem is that the ledger, the reports and the spreadsheets are three different versions of the truth.
Every module reads and writes the same ledger — which is why the numbers agree everywhere, and why nothing needs exporting to reconcile.
P&L, margins and balance sheet, computed live from the posted ledger — never from a cached export.
Live from the ledgerBalance-enforced double entry. Draft, then post. An unbalanced entry is impossible by construction.
Cannot go out of balanceAdd, edit, disable or delete accounts. Cost centres, multi-entity, full control of your structure.
13 and 26-week projections as versioned runs, so you can compare this week's view against last week's.
13 / 26 weeksPeriod-to-date and run-rate variance against actuals, as versioned runs you can revisit and defend.
Income statement, balance sheet and cash flow with a compliance framework — plus PDF board-pack export and drill-down into the source entries.
PDF + drill-downInvoices, aging buckets and payments — and paying an invoice posts straight to the real ledger.
Aging built inAssumption-driven P&L and cash modelling with covenant impact: interest coverage, leverage, DSCR, current ratio — and breach warnings.
NPV, IRR, payback, discounted payback and profitability index on your own cash-flow assumptions.
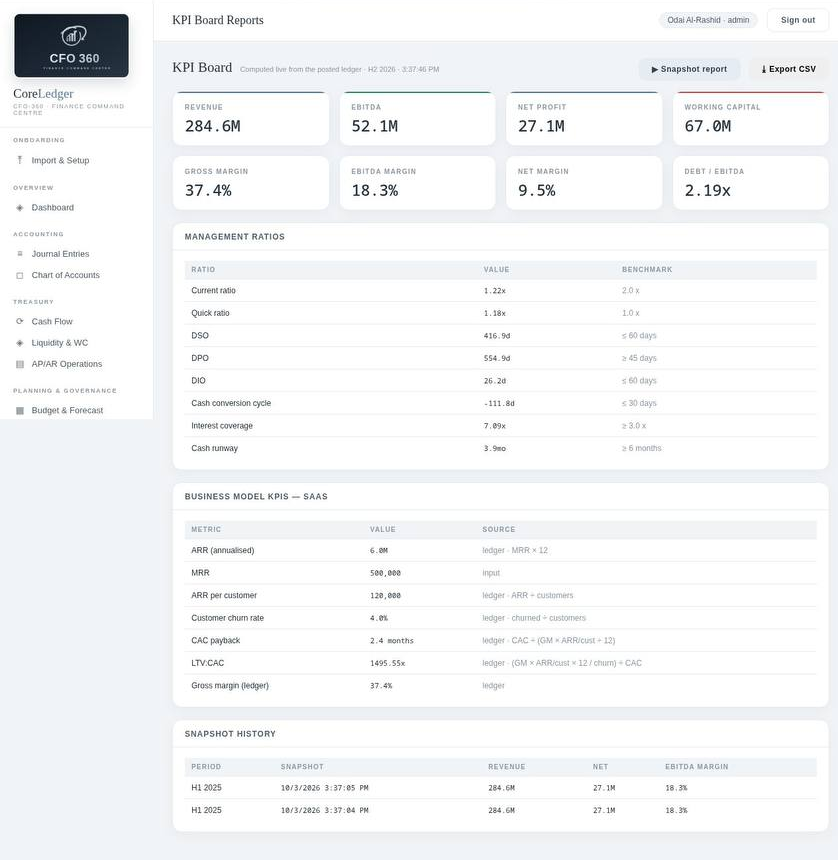
NPV · IRR · PIA KPI board with snapshots and CSV export, plus a business-model layer: SaaS ARR, CAC payback and churn, or contractor WIP and backlog.
Threshold rules with hysteresis, a scheduler and email — plus a scan for duplicate payments, duplicate journals and vendor spend spikes.
Finds what you missedA briefing and cost recommendations drawn from your ledger — deterministic, and citing the source entries behind every figure.
Every claim citedMost systems keep a ledger and a separate reporting layer — and those two drift apart. CFO360 computes every statement, ratio and KPI directly from the posted journal. There is no second version of the truth to reconcile.
The ledger enforces the balance to the fils, so the books can't quietly drift out of shape.
Never floats. 1/100 AED as whole numbers, converted only at the edge — so rounding never accumulates.
Statements drill down into the journal lines behind them. Nothing is a number you have to take on faith.
Every record carries its organisation; users are soft-audited. Built to hold more than one company from day one.
Live values from the demo company — computed from posted journal entries, not typed in.
A P&L tells you whether the business worked. It does not tell you whether you can make payroll on the 25th. CFO360 answers the cash questions directly from the ledger — including the answers you won't enjoy reading.
Cash is 33.1M — but 27.15M is the three-month operating buffer. Total cash and deployable cash are two different numbers, and the gap is the point.
Every extra day is capital trapped inside the business instead of working for you. The cash conversion cycle is −109.2 days — faster than the cycle looks, because payables run long.
Without this number you're making capital decisions without a safety floor. Current ratio 1.22× against a 2.00× benchmark.
Because profit is accounting. Cash depends on timing, terms and capital spending. The two are allowed to disagree — you just need to know by how much and why.
Operations are not self-funding this period: the cash-earning half is 39.5M, while working-capital timing drags 56.2M the other way. Collecting faster or paying slower flatters a balance. It doesn't mean the business generates more cash.
Bucketed 0–30 / 31–60 / 61–90 days, with a 2.55× coverage ratio and 20.13M remaining after the window. Debt service, leases and earnouts don't wait — and surprises here are always expensive.
Borrowed growth and organic growth carry different risks — and most boards never separate them. Debt and leases are 136.7M of a 388M capital base: repayable on someone else's terms.
Today's balance is 33.1M. At a 30% revenue decline it goes negative inside the quarter: EBITDA falls 61% (52.1M → 20.2M) and net profit collapses to 1.73M. Two covenants break — interest coverage 1.39× against a 1.50× floor, leverage 5.66× against 3.00×. Model it before the scenario is real, or find out the hard way.
Every figure above is computed from the demo company's posted journal. Nothing is typed in, and nothing is rounded up to look better. The cash-quality engine asserts that its split re-sums to the cash-flow statement's own operating cash, so it can't drift from your books.
And where the system can't be precise, it says so instead of pretending. Debt service is derived from the ledger finance-cost run rate and labelled an estimate. Lease liabilities with no payment schedule are reported as an undated balance. Earnouts, debt maturity dates and committed capex are named as not modelled — never guessed at to fill a gap.
Demo company · H1 2025 · figures in AED
CFO360 answers in plain language — then shows you the journal entries it read to get there. A briefing you can't trace is a briefing you can't put in front of a board.
A written read on the position, drawn from the ledger rather than a generic template.
Where spend is drifting, flagged from your own accounts.
Ask a question in English. Get the answer, with the source entries attached.
Financial records get the treatment they deserve — fail-closed auth, isolated tenants, and an audit trail you can hand to an auditor.
Access tokens live in memory, never localStorage. Refresh tokens are httpOnly, hashed at rest and rotated — a replayed token is rejected outright.
Every organisation-scoped table carries its org. A second customer is one row — not a shared database with fingers crossed.
Schema validation on every request, parameterised queries everywhere, rate limits on login, AI and public endpoints.
Admin, CFO, finance director, finance manager and viewer — each scoped to what they should actually touch.
The service refuses to boot without its secrets rather than limping up with defaults. Migration-first schema, transactional and replayable.
Structured logs, a health endpoint and graceful shutdown — so it behaves in production instead of needing a babysitter.
Monthly or annual. One-time implementation. No per-seat games.
Every plan starts with onboarding: AED 2,500–15,000 one-time — migration, chart-of-accounts mapping, model configuration, training.
Leave your details and we'll send you access to a live demo of CFO360, running on a real ledger.
No sales sequence. One reply from a human.